QC R scripts
Following R scripts can be found at github.com/PacificBiosciences/barcoding/scripts/r. Ensure that all R dependencies are installed
install.packages(c("ggplot2","dplyr","tidyr","viridis","scales","data")) ## report_detail.R
The first is for the lima.report file: report_detail.R. Example:
$ Rscript --vanilla report_detail.R prefix.lima.report
The second, optional argument is the output file type png or pdf, with png as default:
$ Rscript --vanilla report_detail.R prefix.lima.report pdf
You can also restrict output to only barcodes of interest, using the barcode name not the index. For example, all barcode pairs that contain the barcode “bc1002”:
$ Rscript --vanilla report_detail.R prefix.lima.report png bc1002
A specific barcode pair “bc1020–bc1045”; note that, the script will look for both combinations “bc1020–bc1045” and “bc1045–bc1020”:
$ Rscript --vanilla report_detail.R prefix.lima.report png bc1020--bc1045
Or any combination of those two:
$ Rscript --vanilla report_detail.R prefix.lima.report pdf bc1002 bc1020--bc1045 bc1321
Yield
Per-barcode base yield: 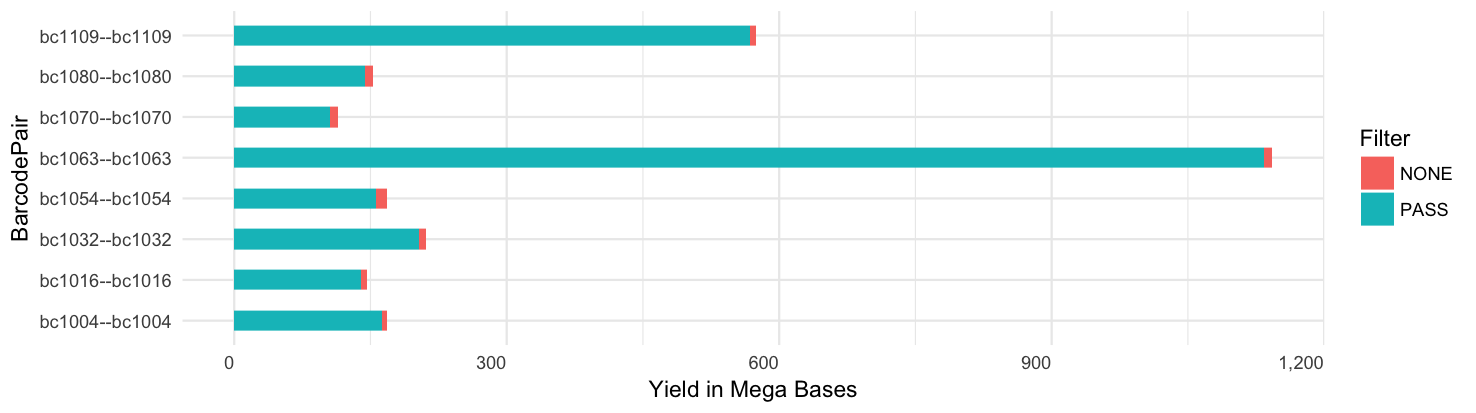
Per-barcode read yield:

Per-barcode ZMW yield: 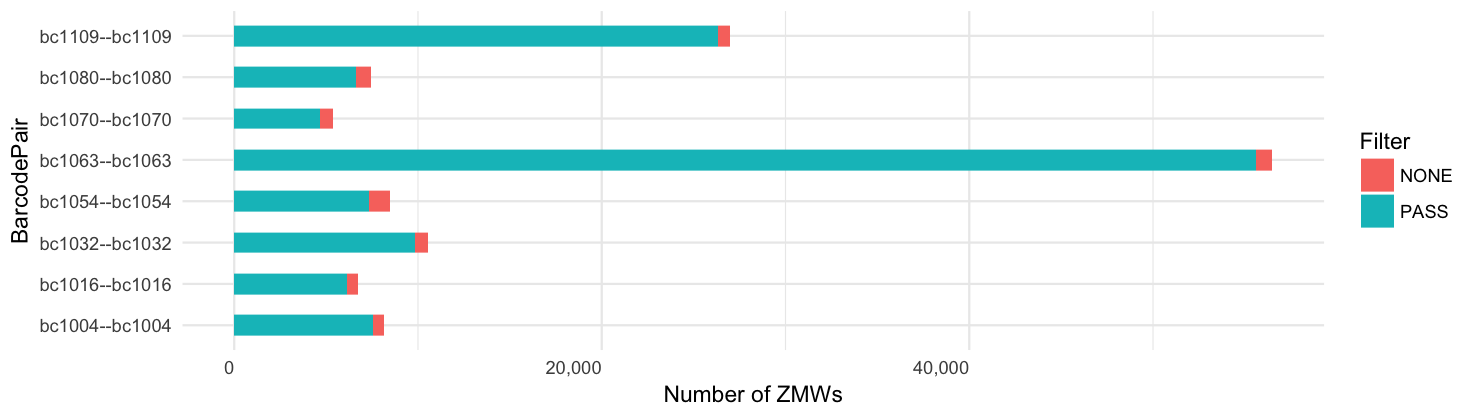
Scores
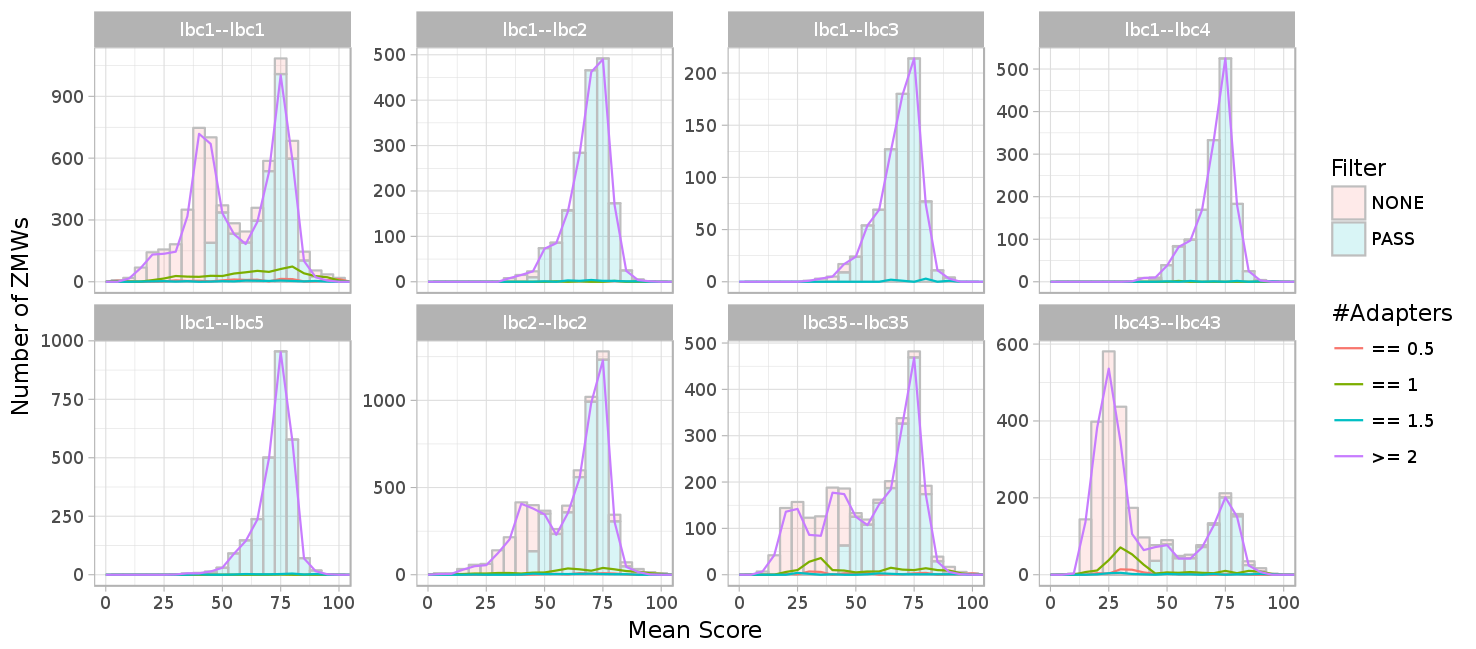
Score per number of adapters (lines) and all adapters (histogram). #What are half adapters?
Read length vs. mean score (99.9% percentile) 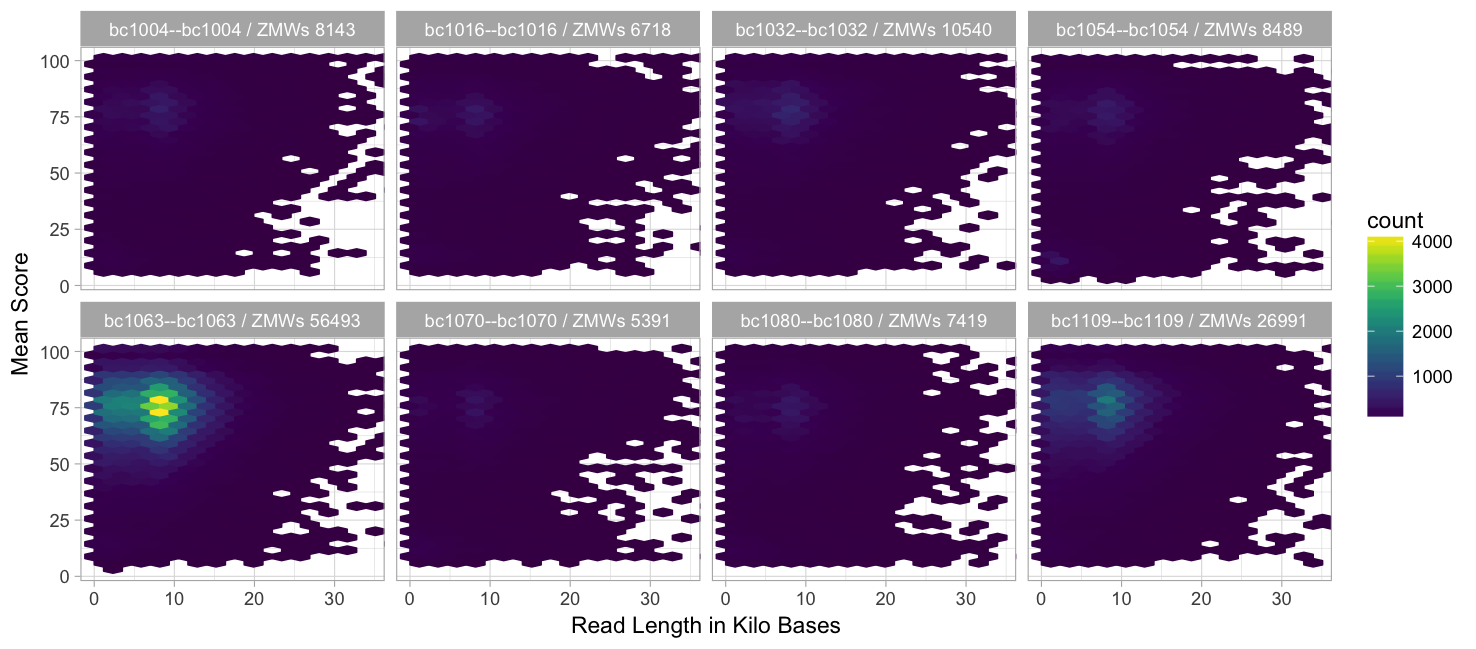
HQ length vs. mean score (99.9% percentile) 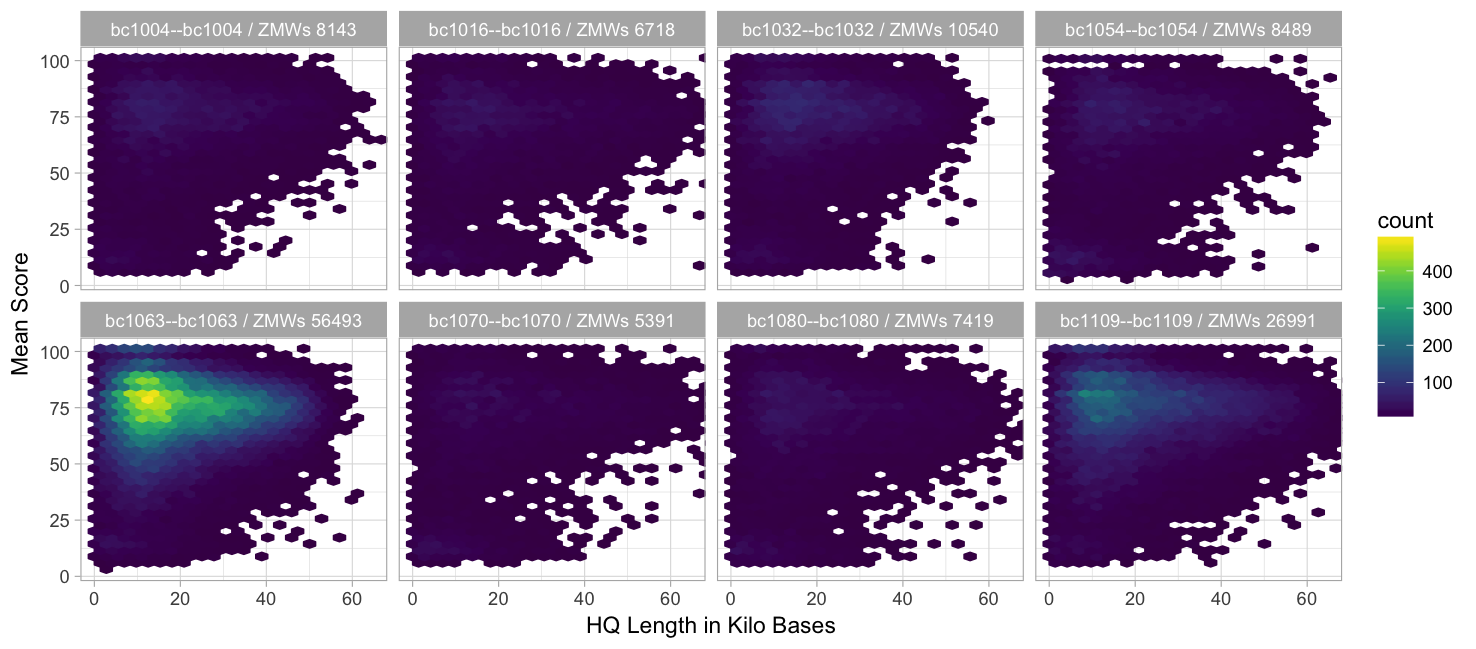
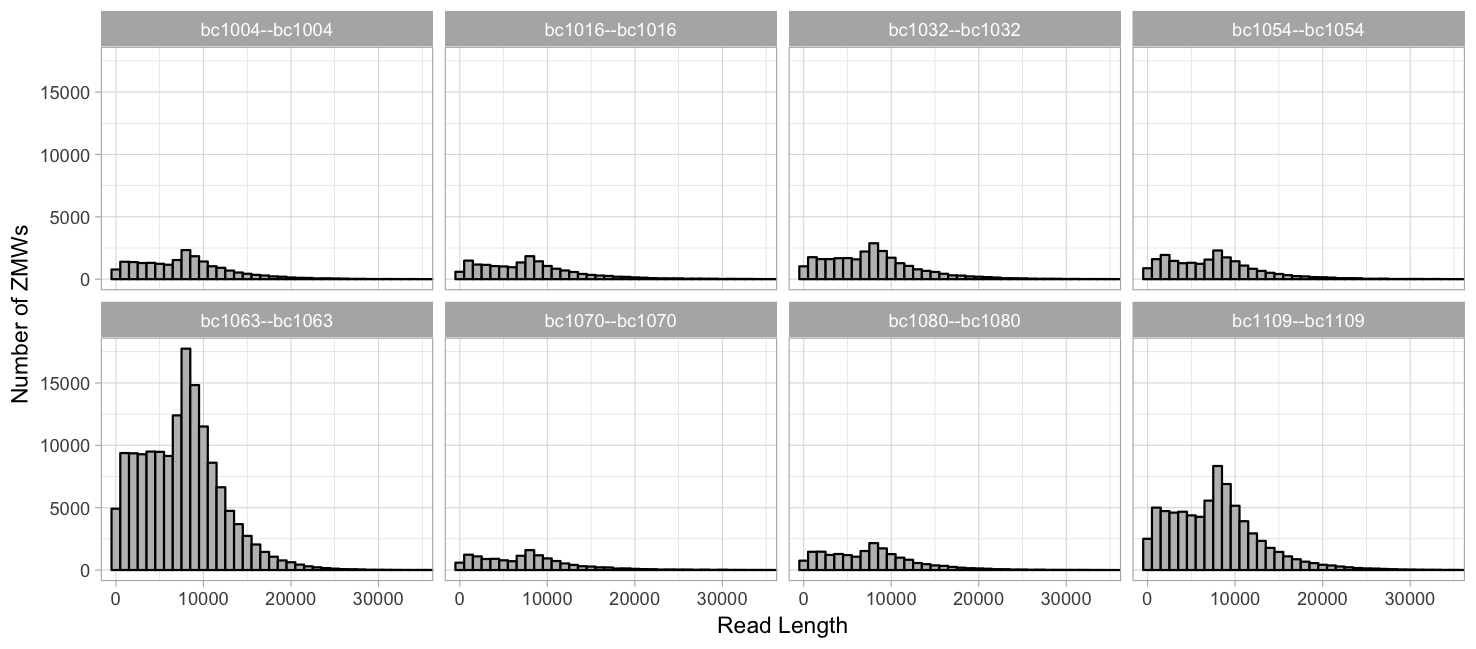
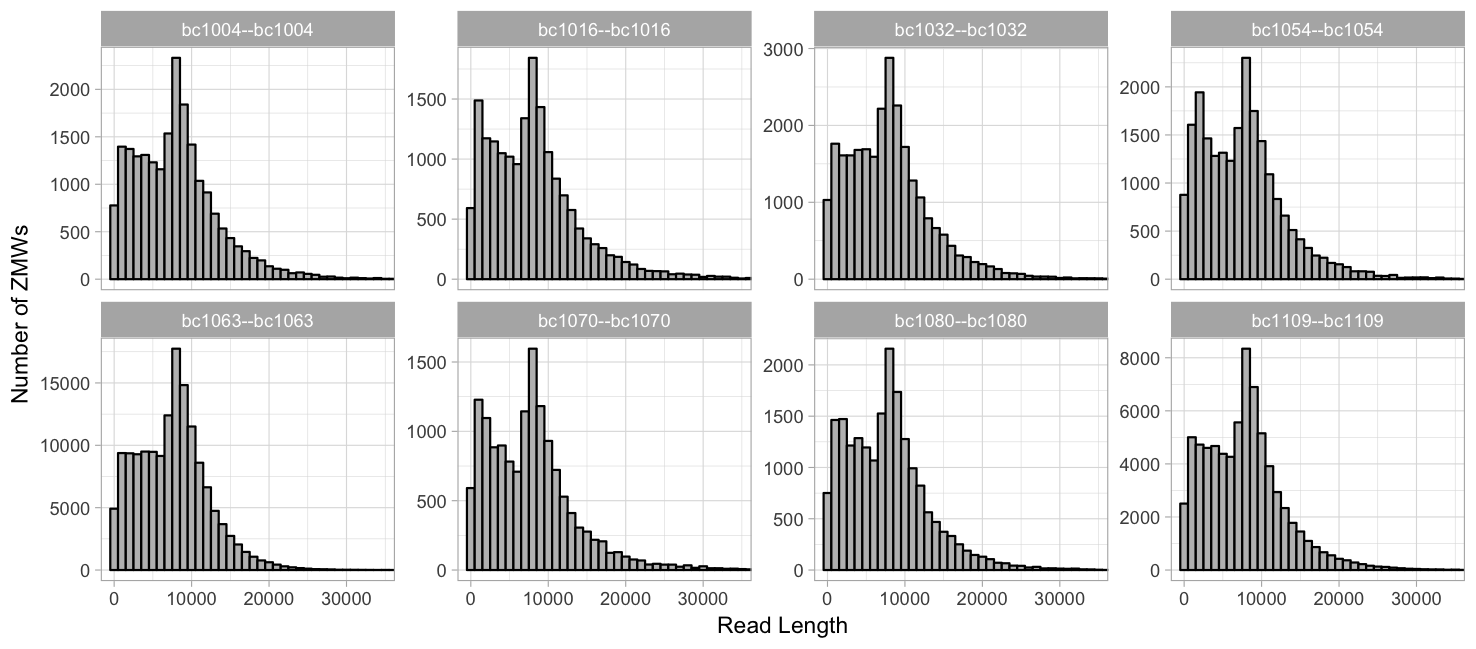
Read length (99.9% percentile, 1000 binwidth)
Grouped by barcode, same y-axis :
Grouped by barcode, free y-axis:
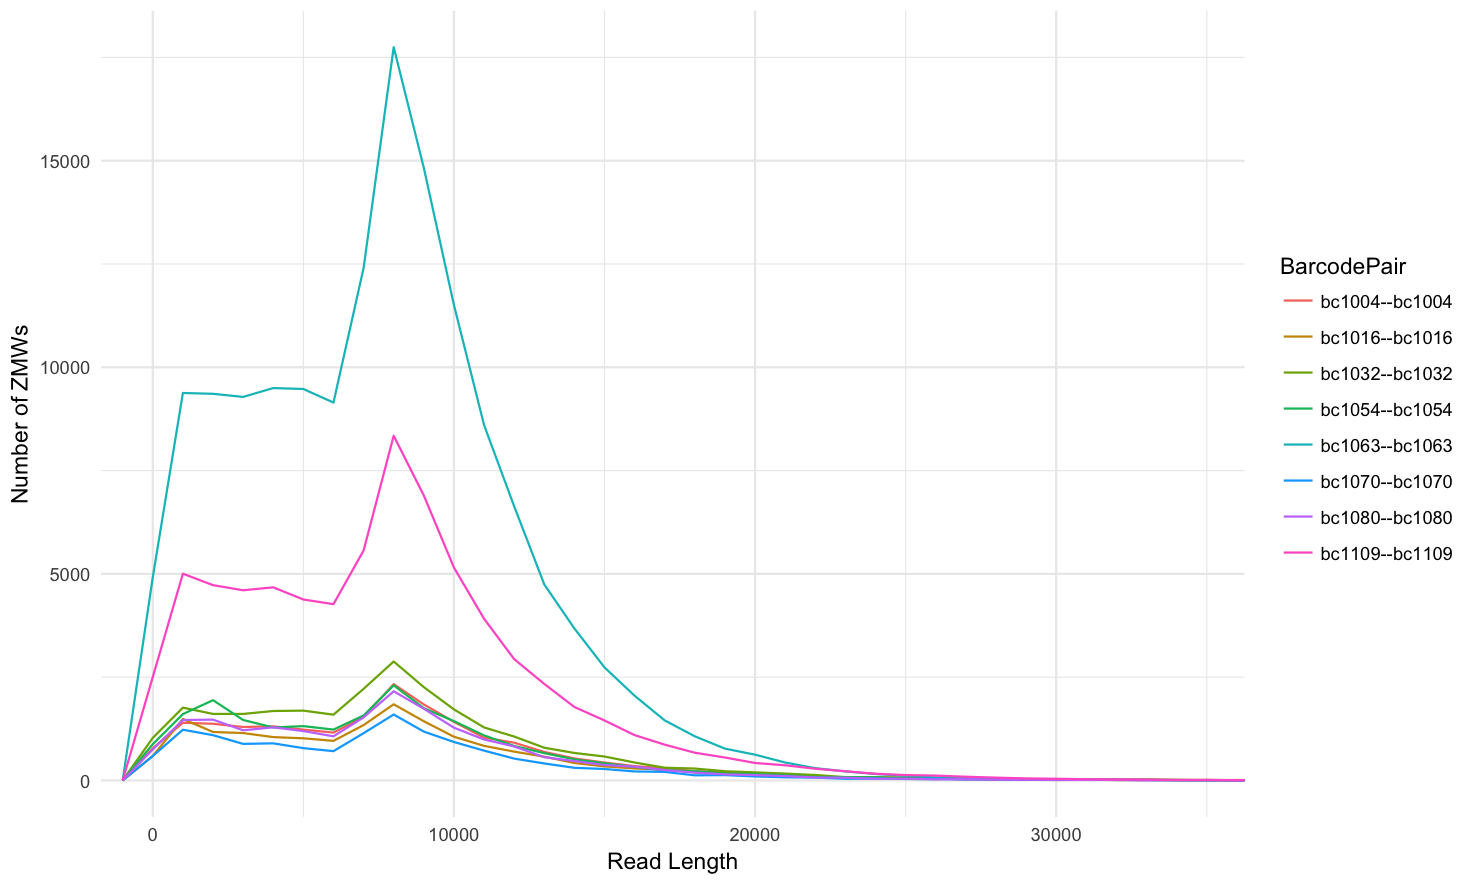
Not grouped into facets, line histogram:
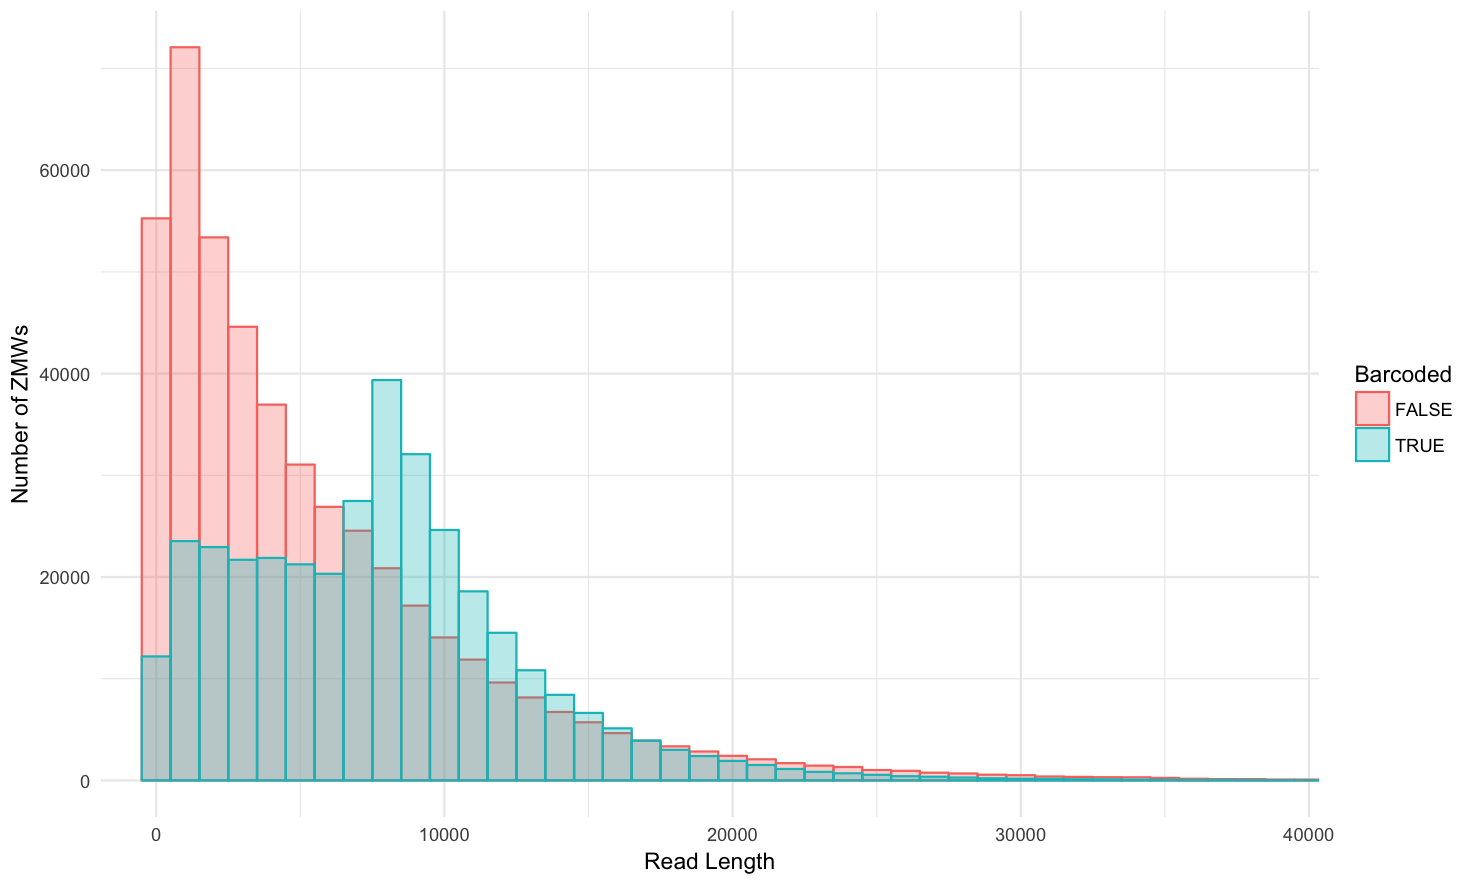
Barcoded vs. non-barcoded:
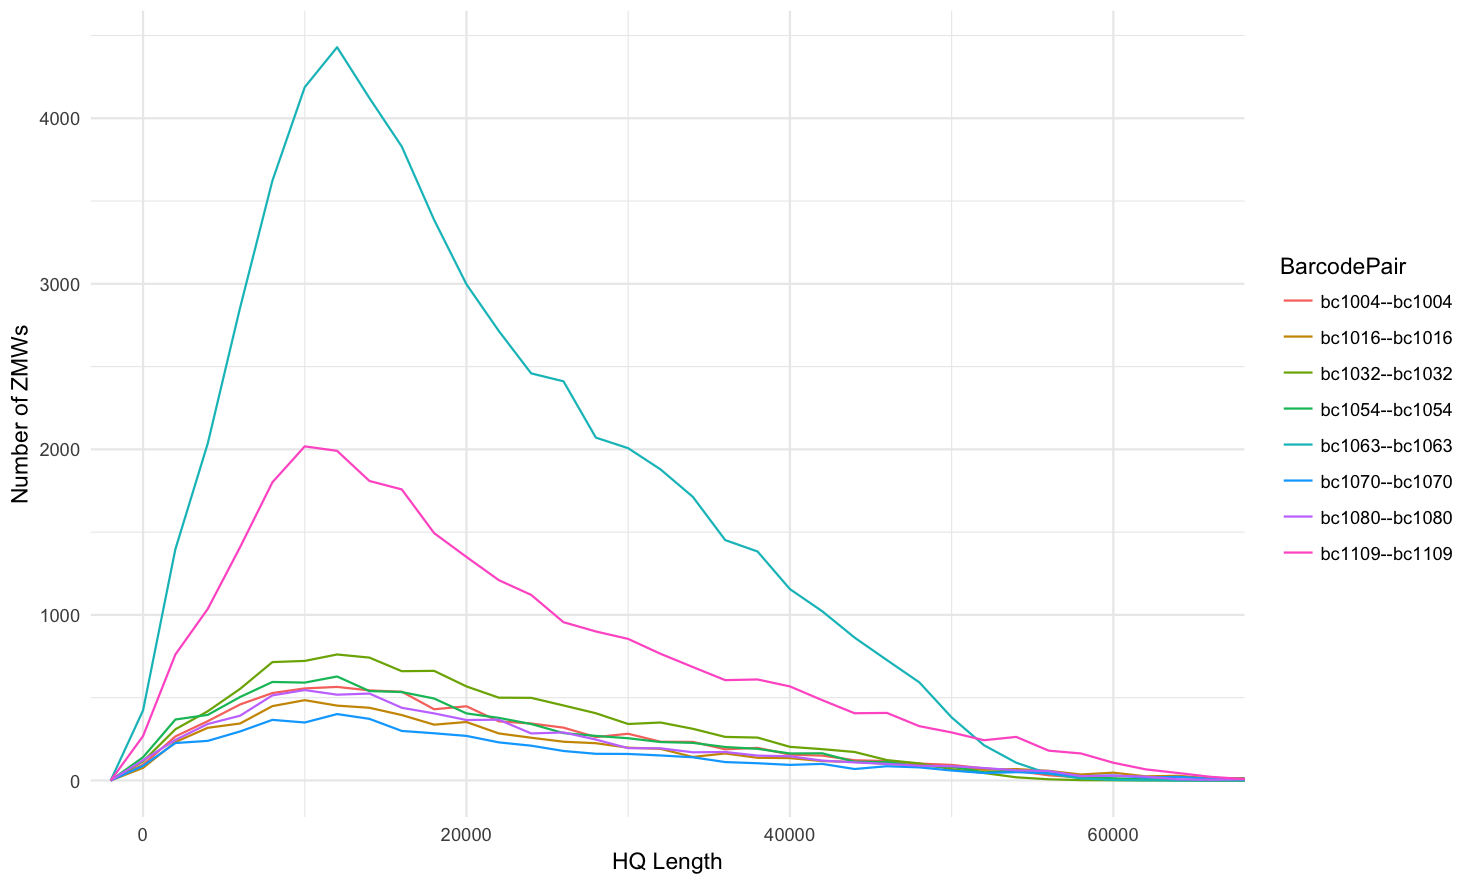
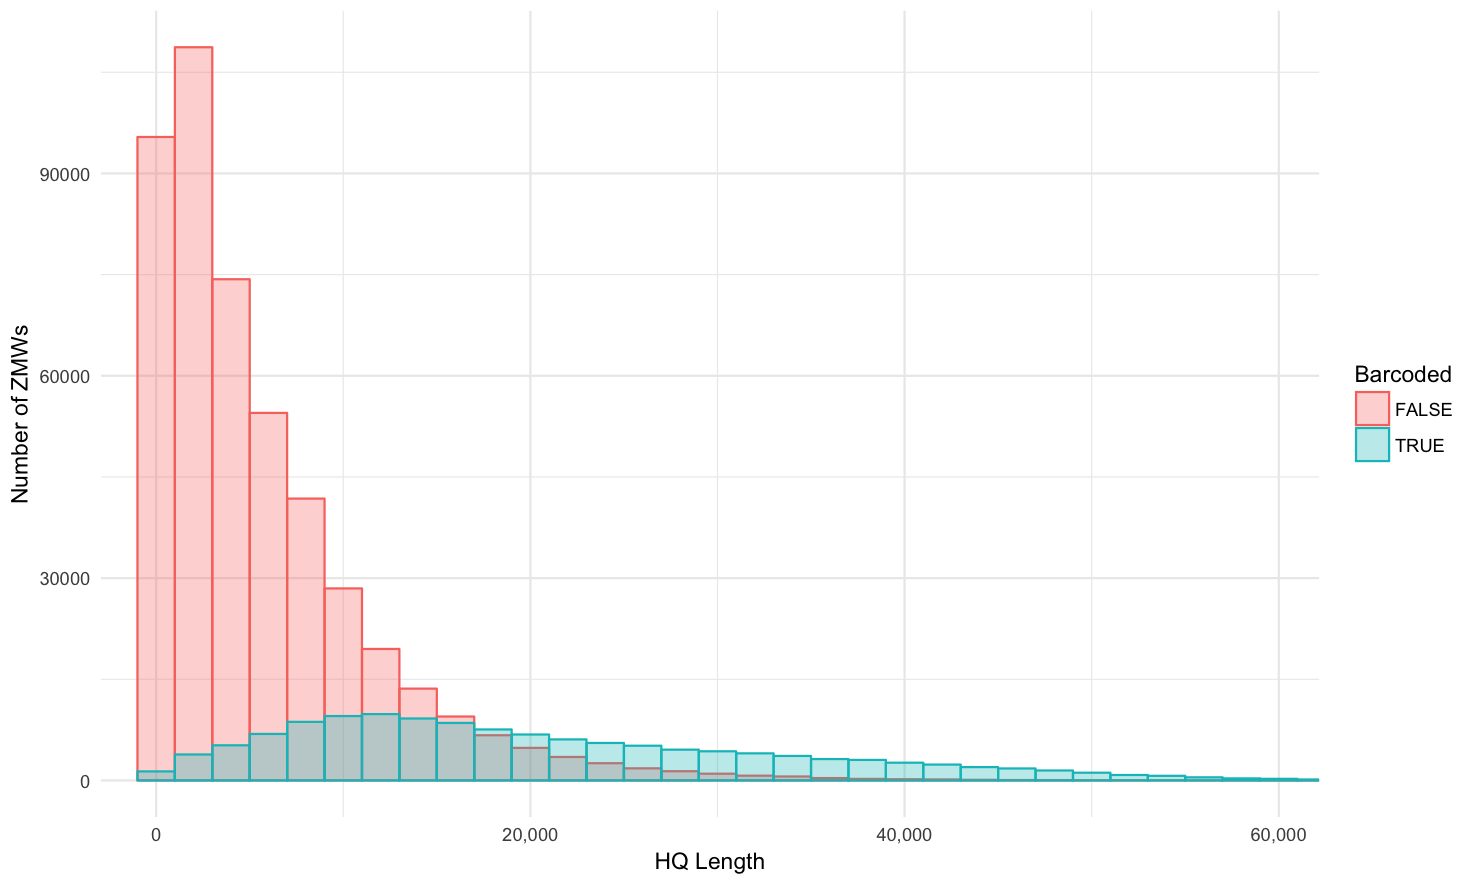
HQ length (99.9% percentile, 2000 binwidth)
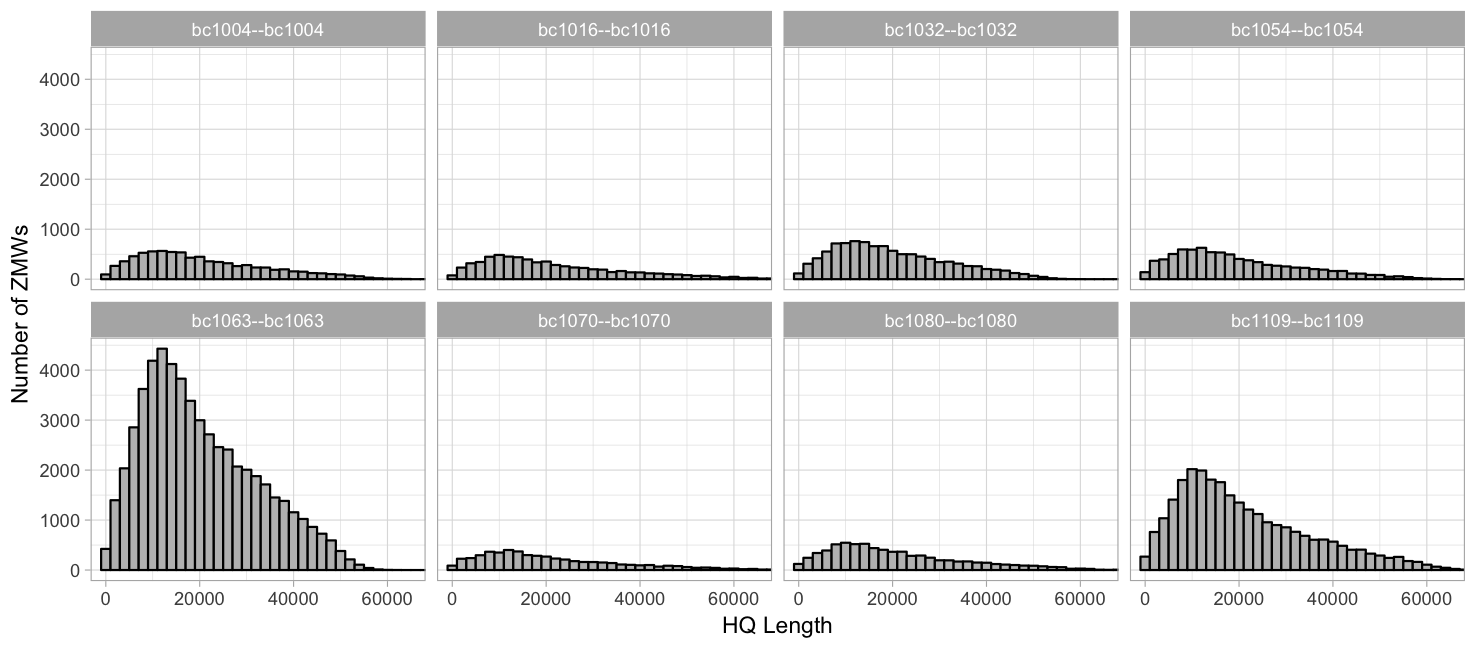
Grouped by barcode, same y-axis:
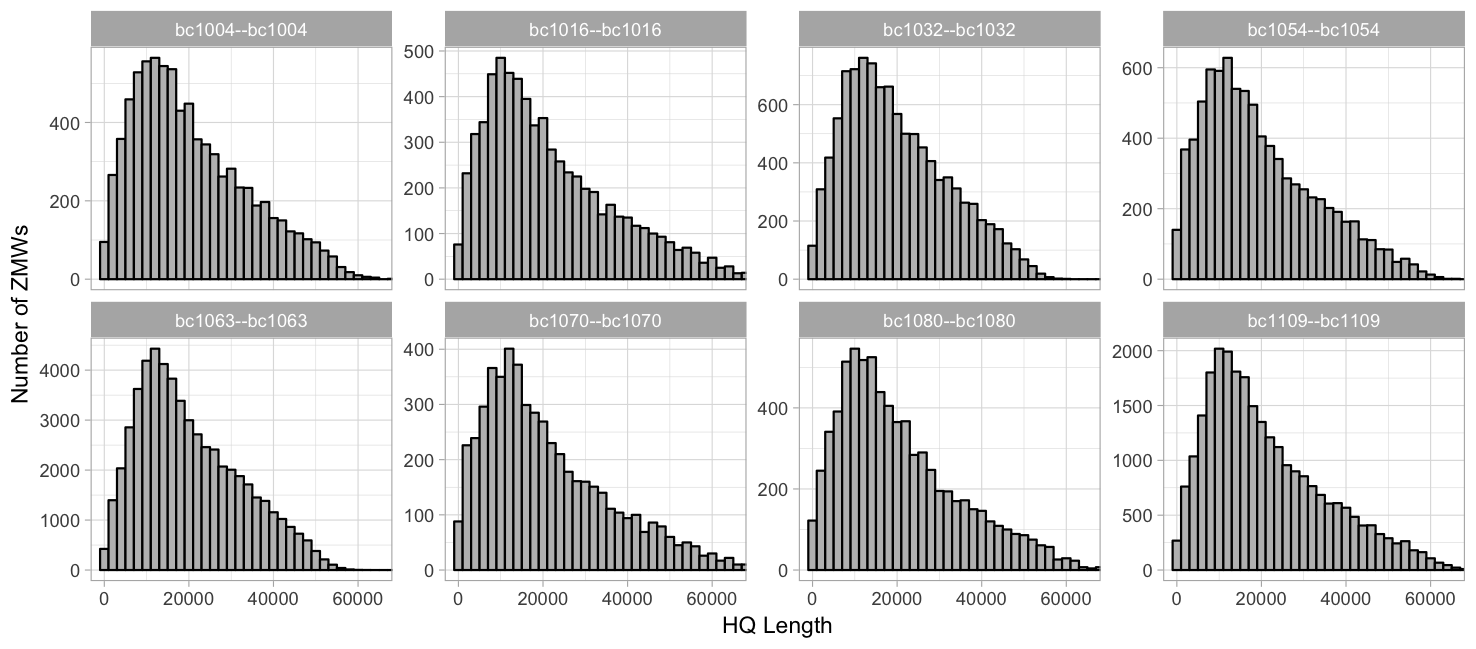
Grouped by barcode, free y-axis:
Not grouped into facets, line histogram:
Barcoded vs. non-barcoded:
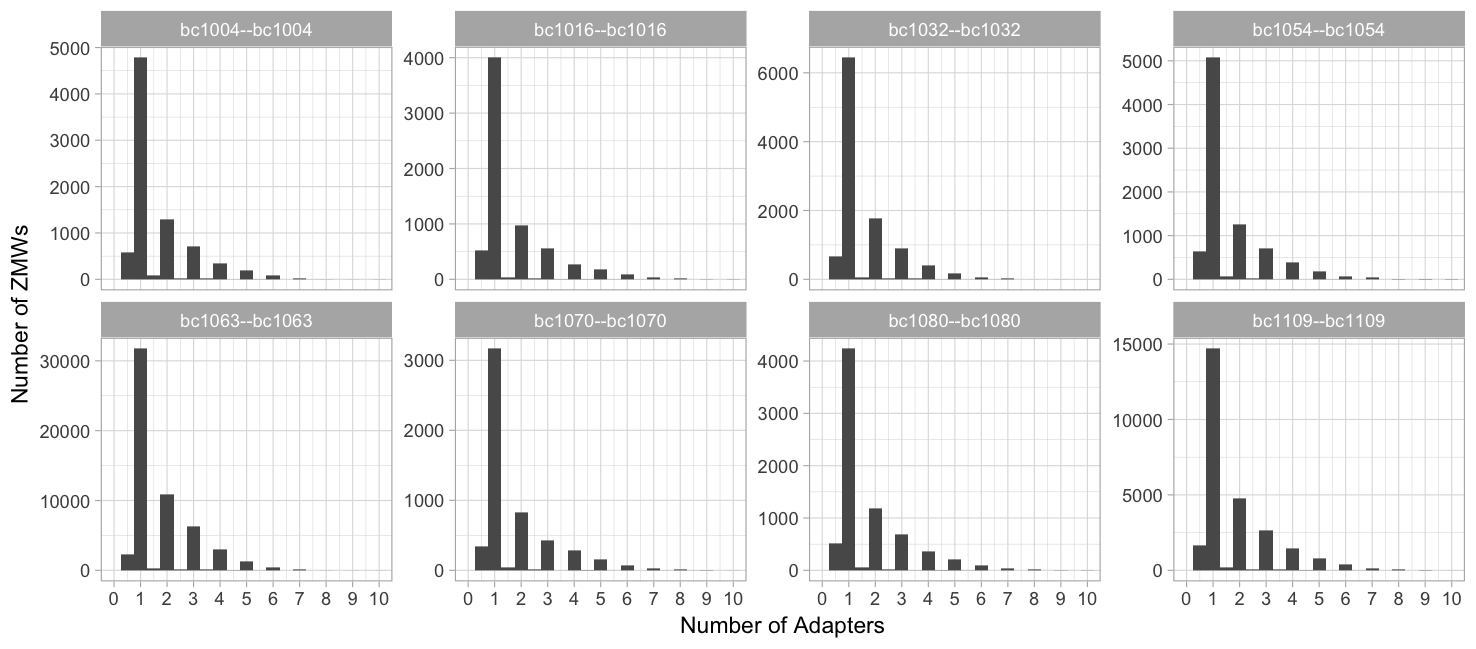
Adapters (99.9% percentile, 1 binwidth)
Number of adapters:
report_summary.R
The second script is for high-plex data in one lima.report file: report_summary.R.
Example:
$ Rscript --vanilla report_summary.R prefix.lima.report
Yield per barcode:
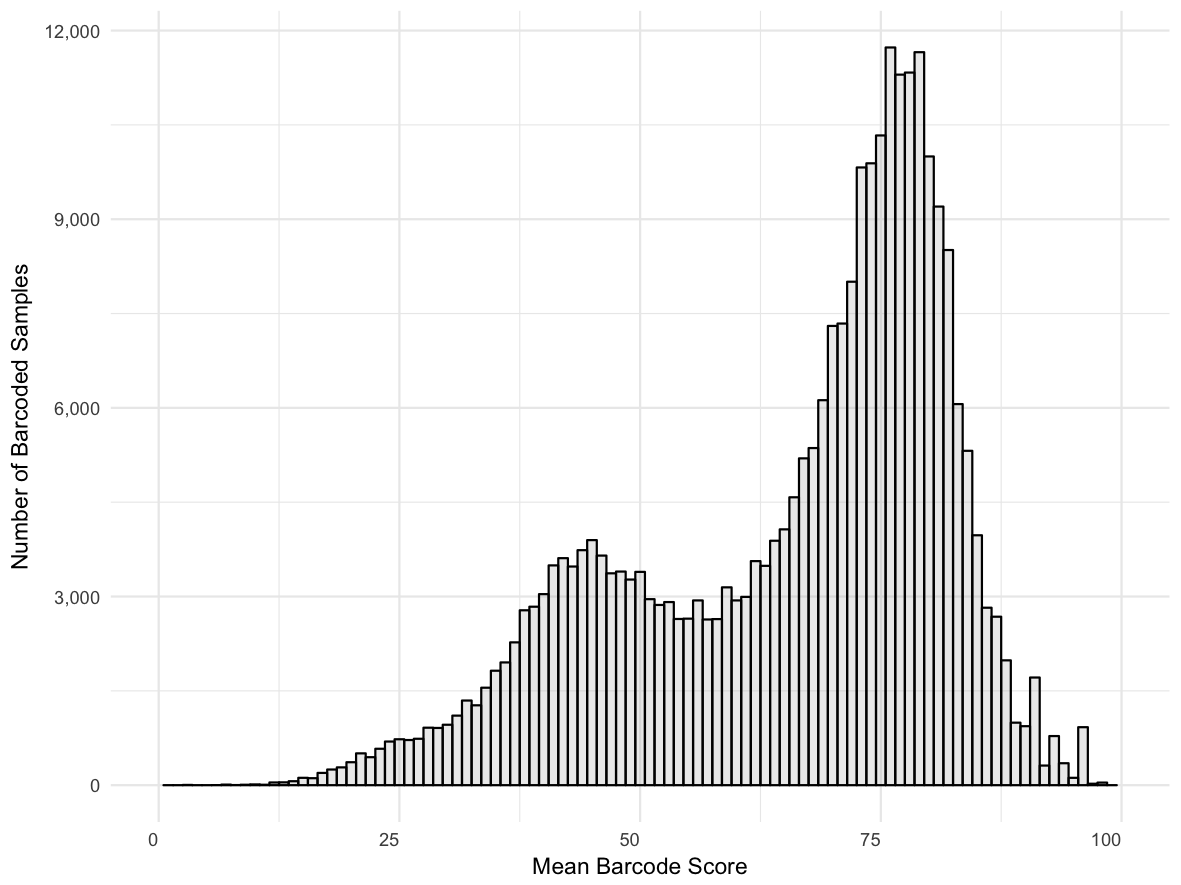
Score distribution across all barcodes:
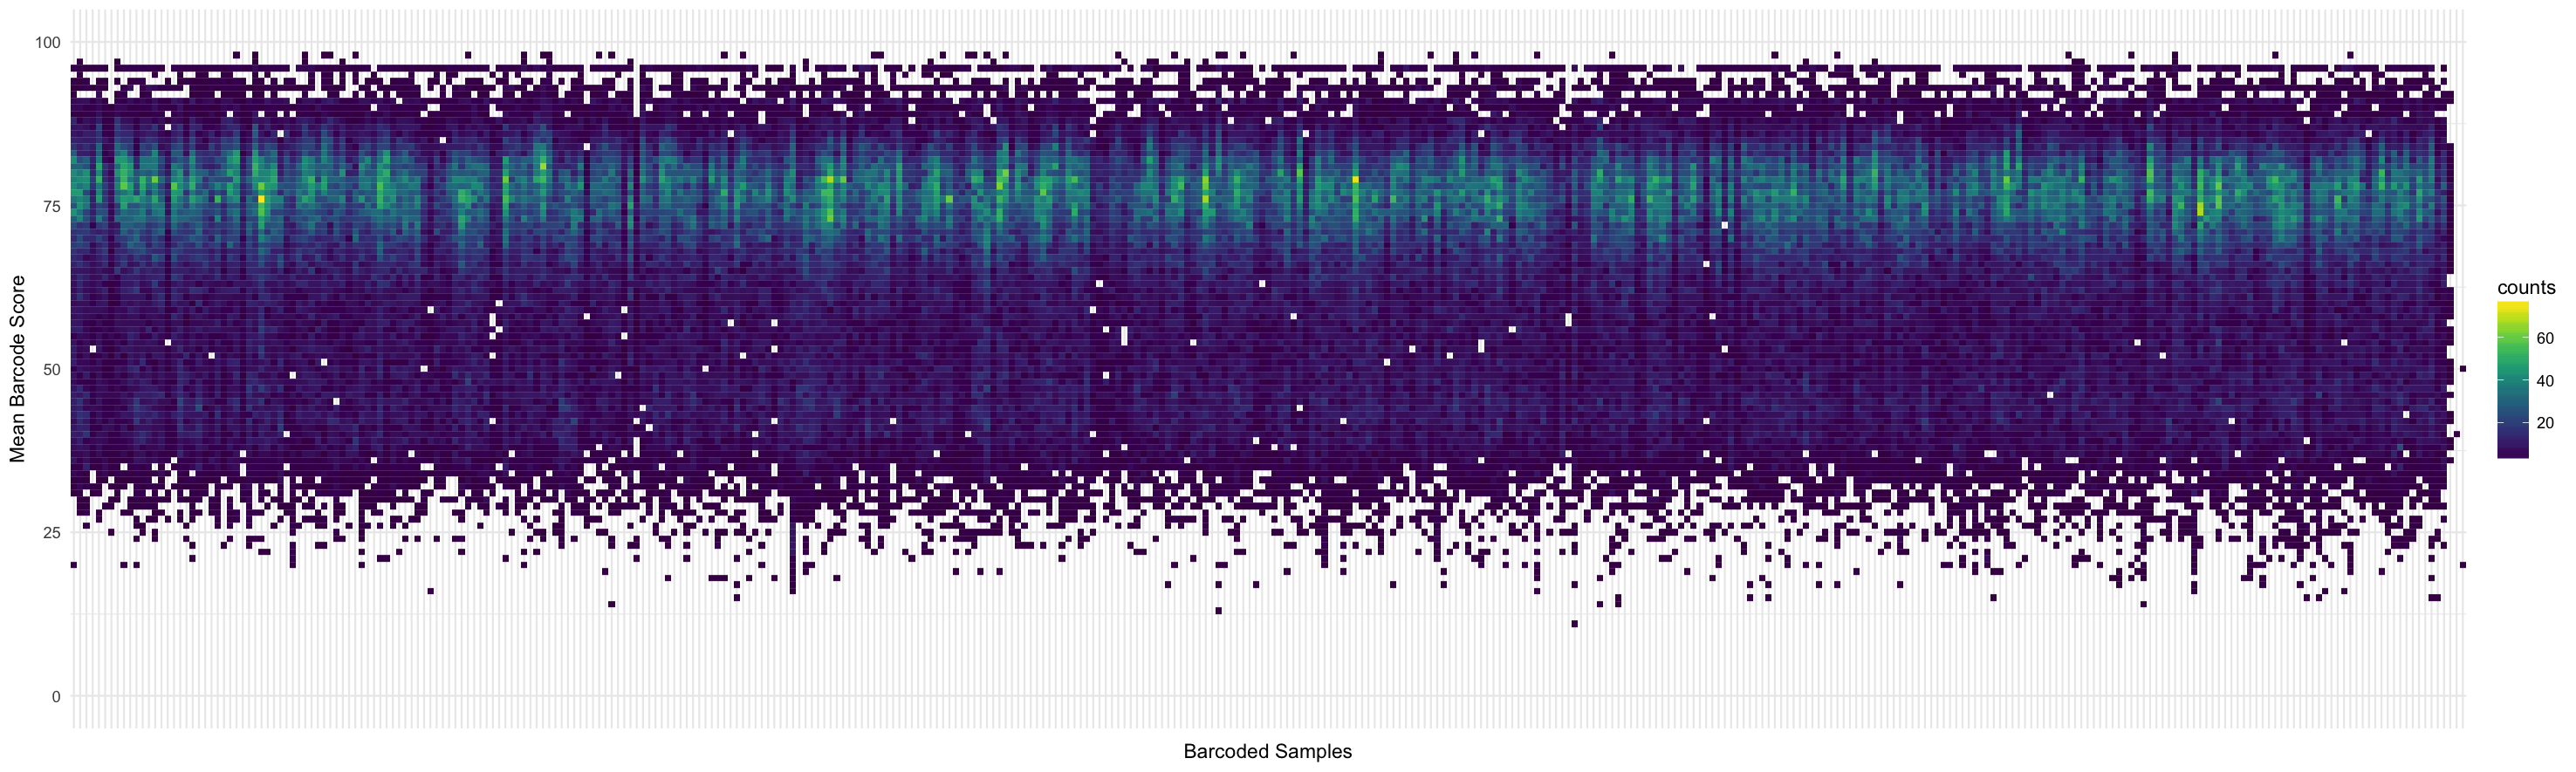
Score distribution per barcode:
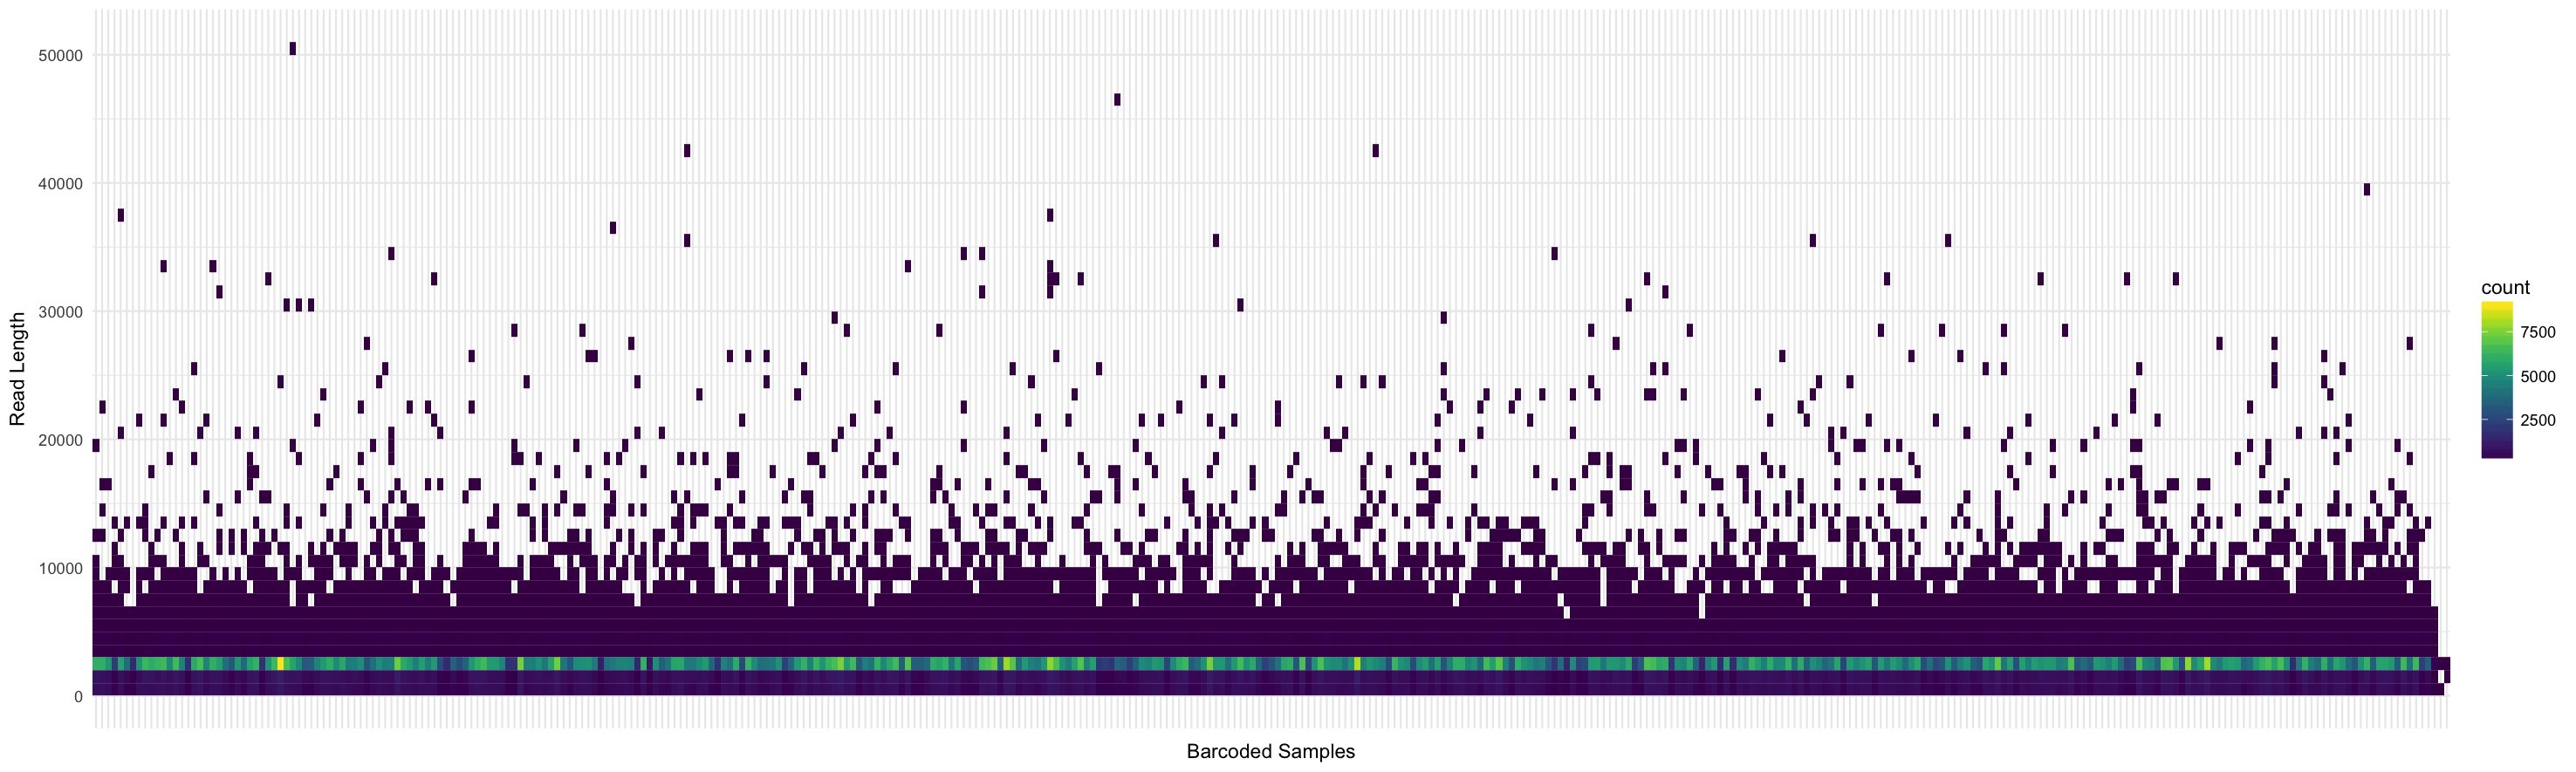
Read length distribution per barcode:
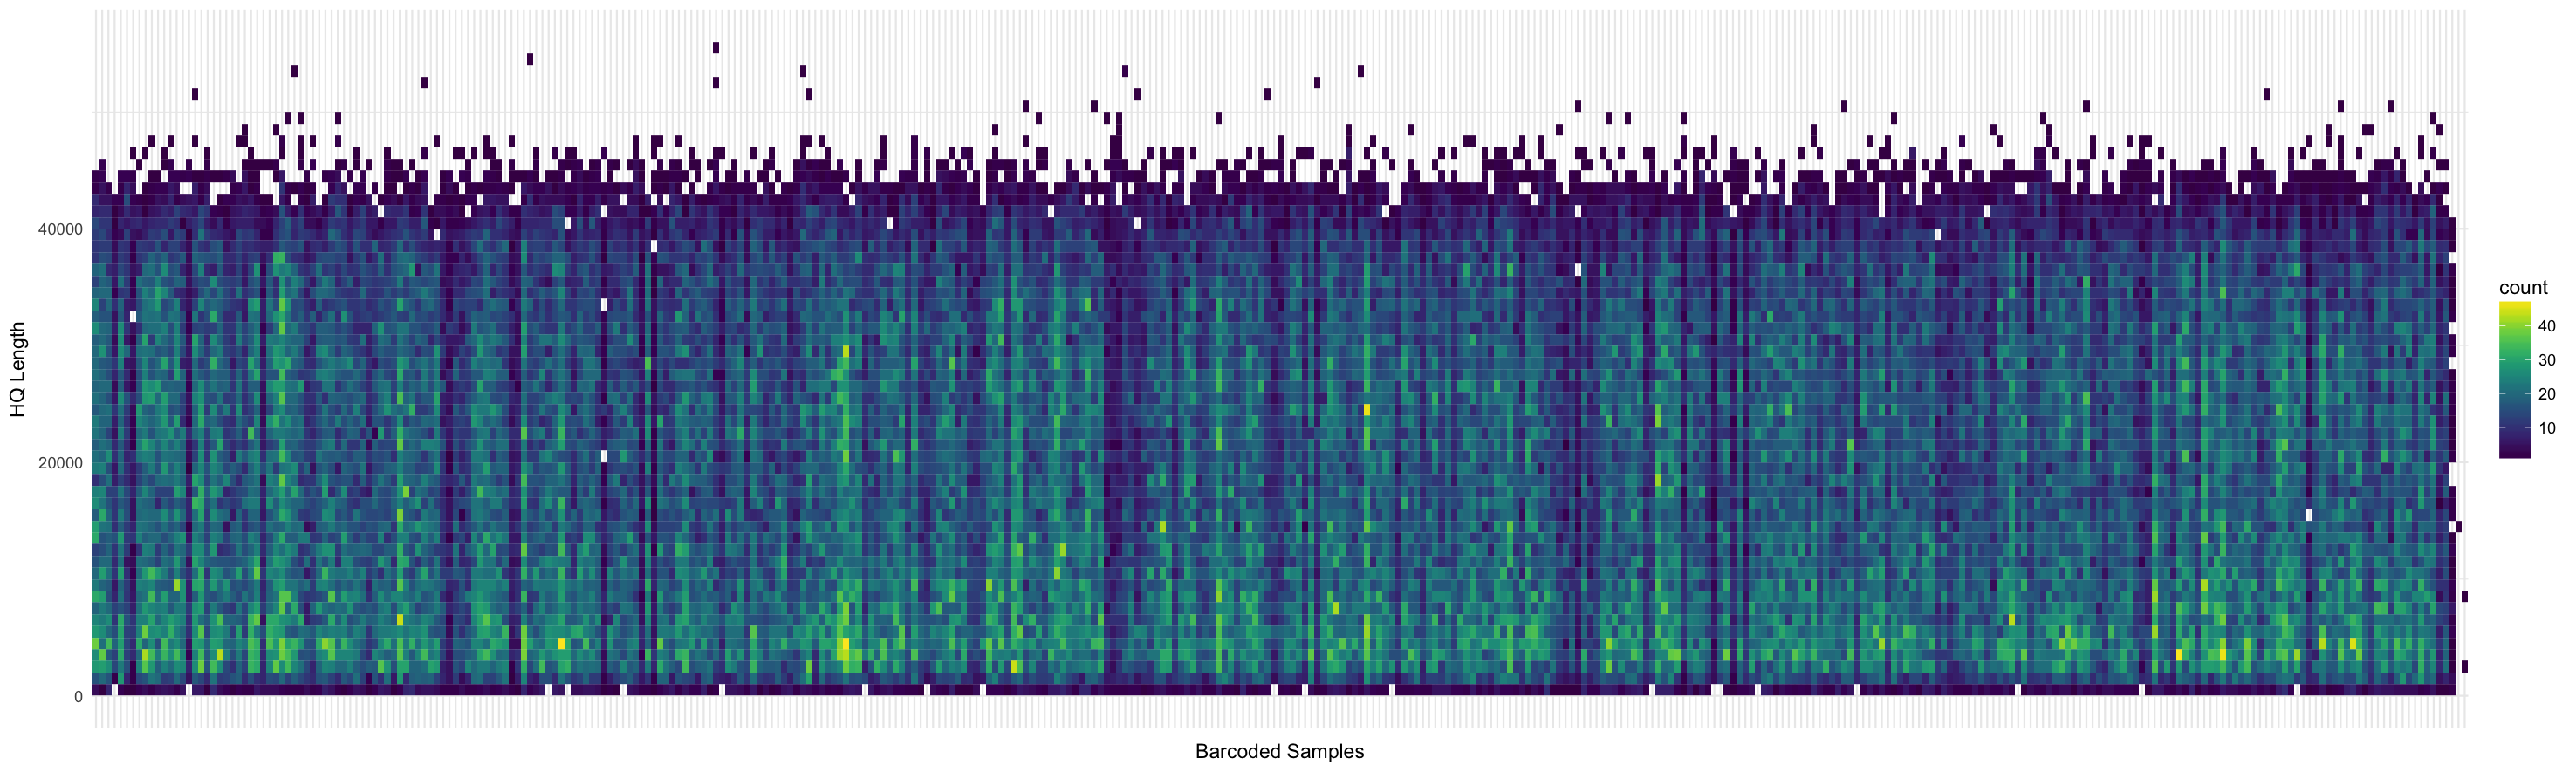
HQ length distribution per barcode:
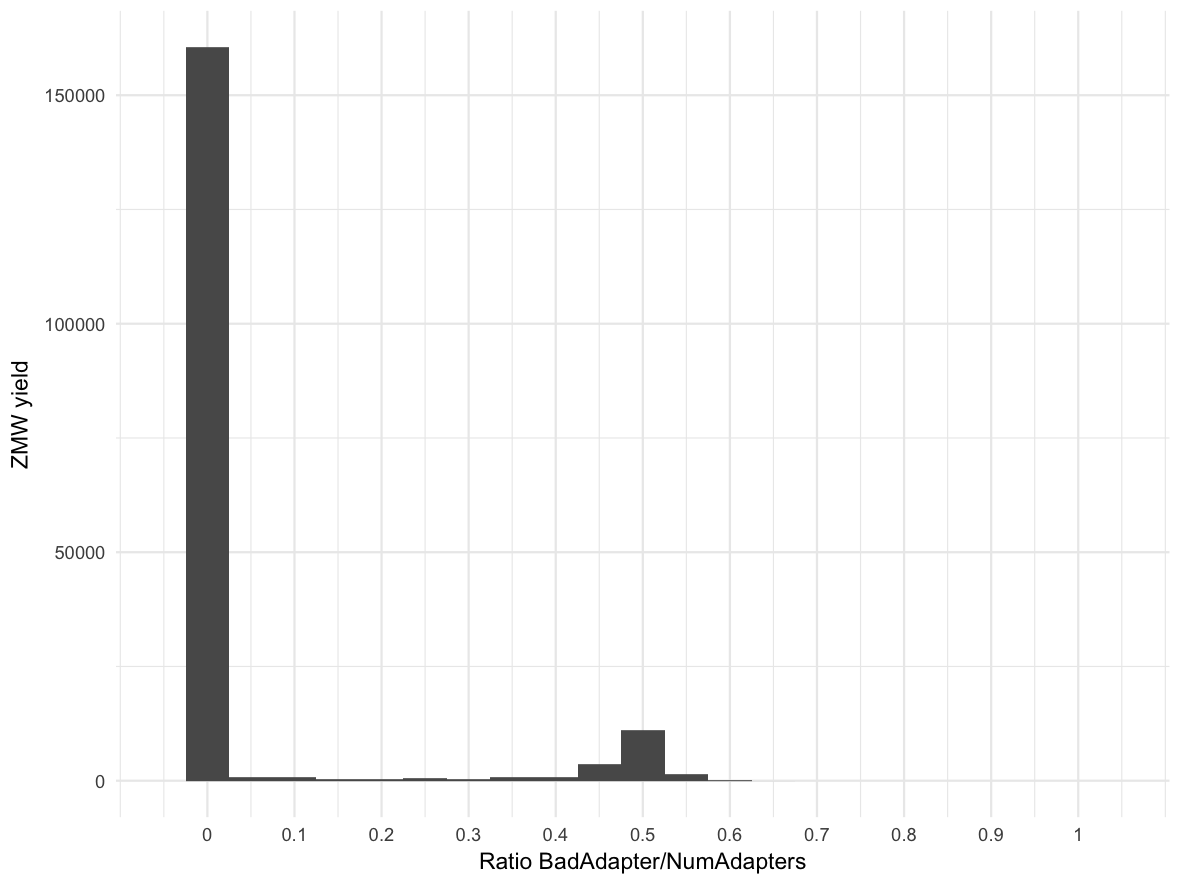
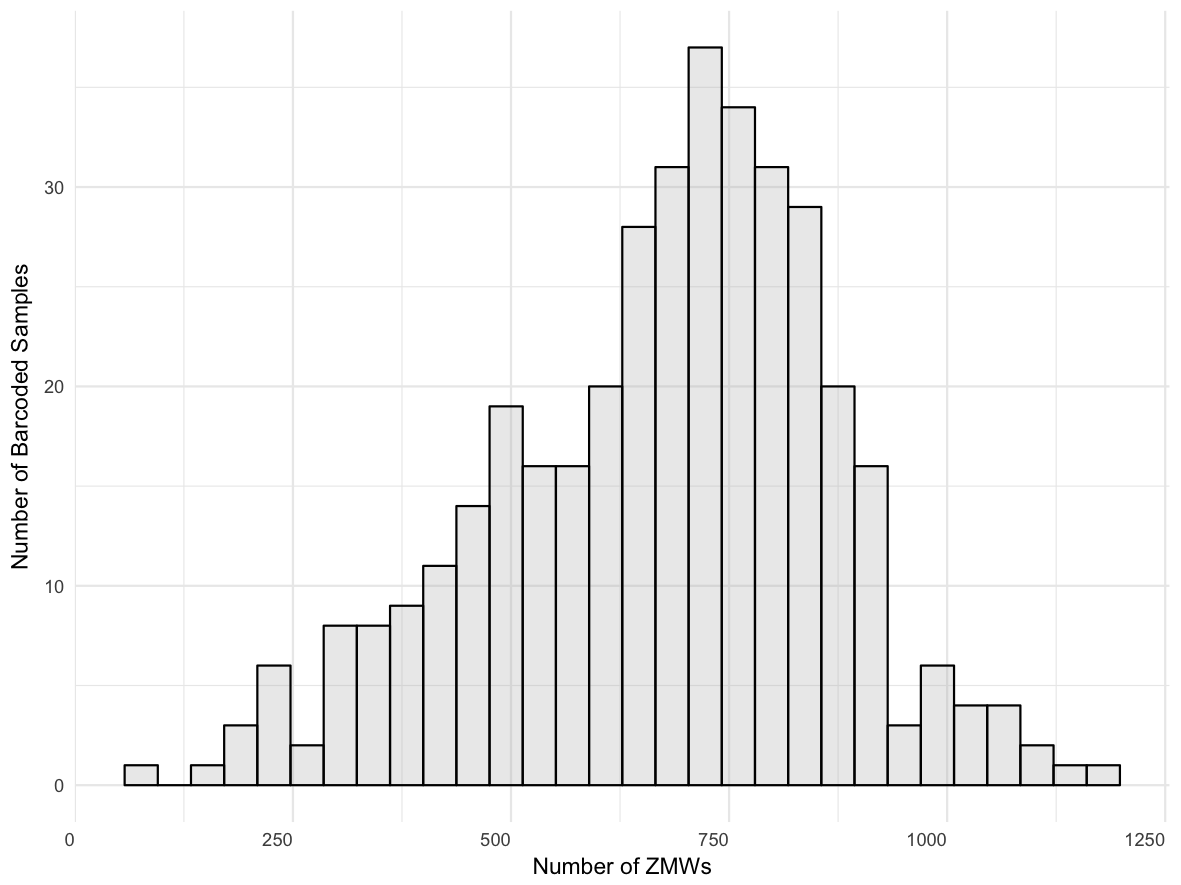
Bad adapter ratio histogram: